Click here to view a video explanation of store ratings.
Store ratings refer to a store’s overall performance over the past four weeks, composed of four indicators: vendor cancellation rate, shipping speed, quality return rate, and average customer rating.
As the most important indicator of a store’s health:
- A good store rating will be directly reflected on product pages. High-rated stores have a conversion rate approximately 5 to 10 times higher than stores with lower ratings.
- For high-rated stores, the platform will provide more traffic support; the higher the score, the more traffic will be allocated.
1. Store Rating Update Frequency
Updated weekly, every Sunday.
The store ratings seen each week are calculated based on the past four weeks.
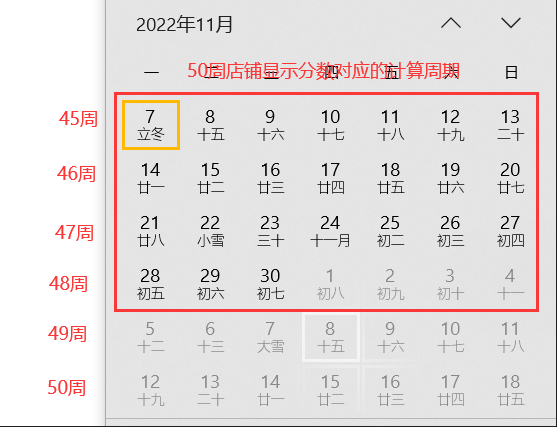
*Note: “Past 4 weeks” refers to a complete calculation period from week -2 to week -5, starting with the week the store rating is updated. As shown in the image below, *the store rating displayed in the backend for week 50 includes weeks 48, 47, 46, and 45, totaling four weeks’ ratings (abbreviated as Last 28 days, or L28D).
2. How to view my store rating?
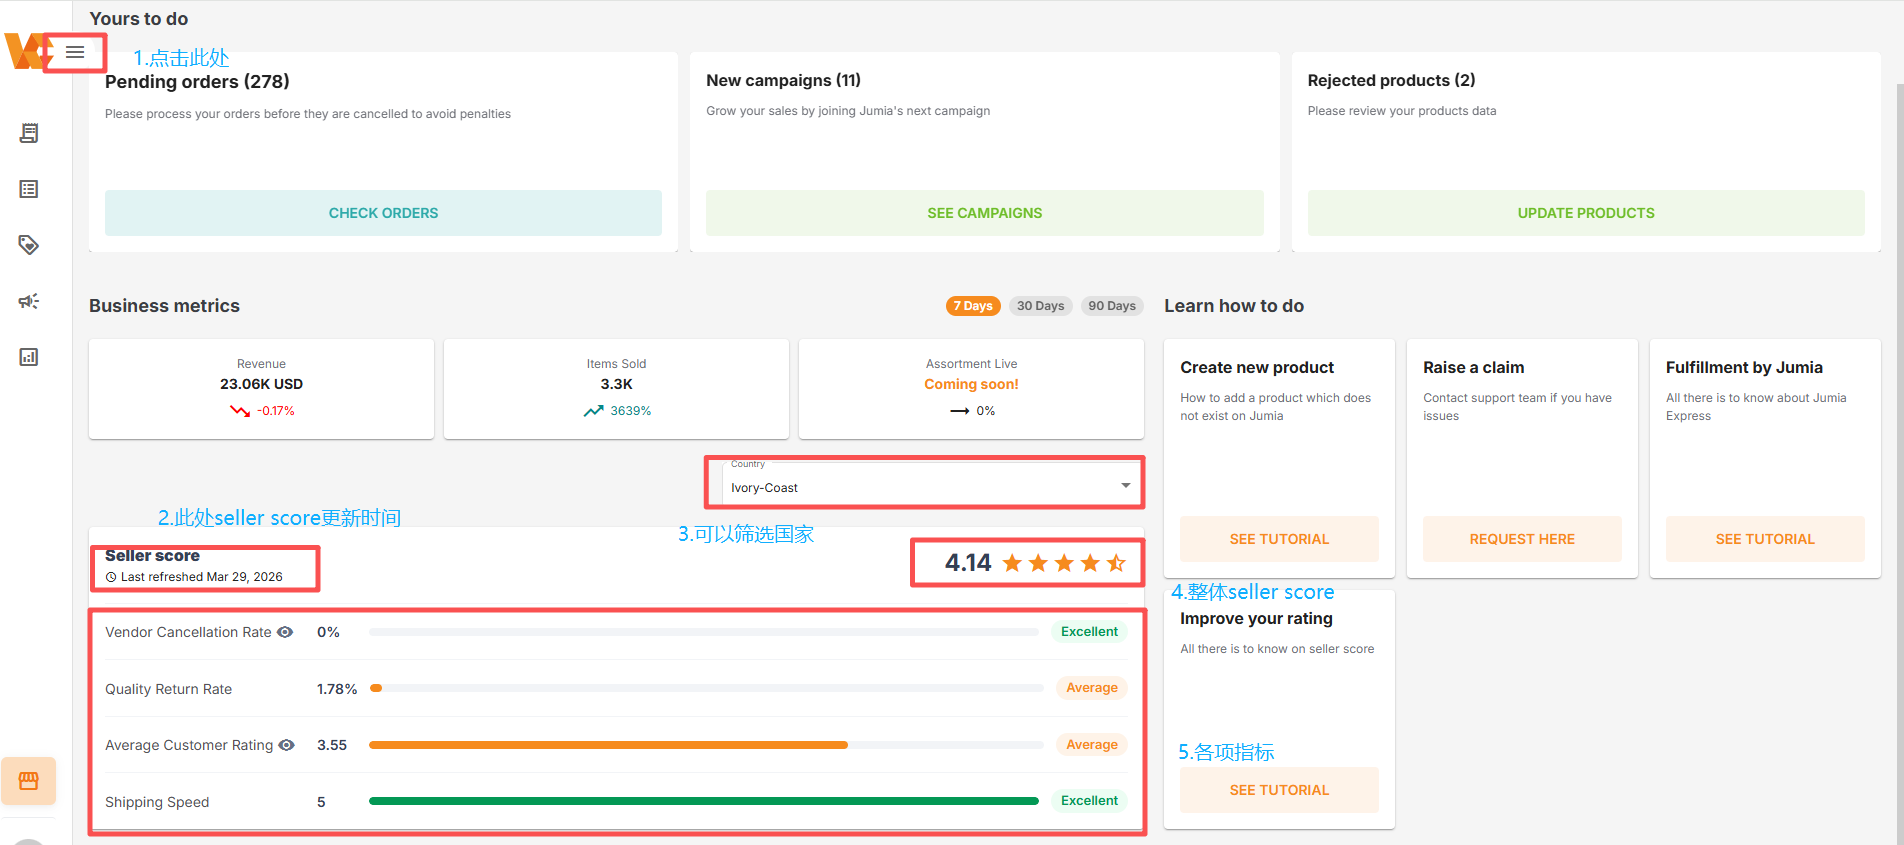
♦ Log in directly to the Seller Center homepage and follow the path: Vendor Center -> Homepage -> “Seller Score” to view your store rating, as shown in the image below:
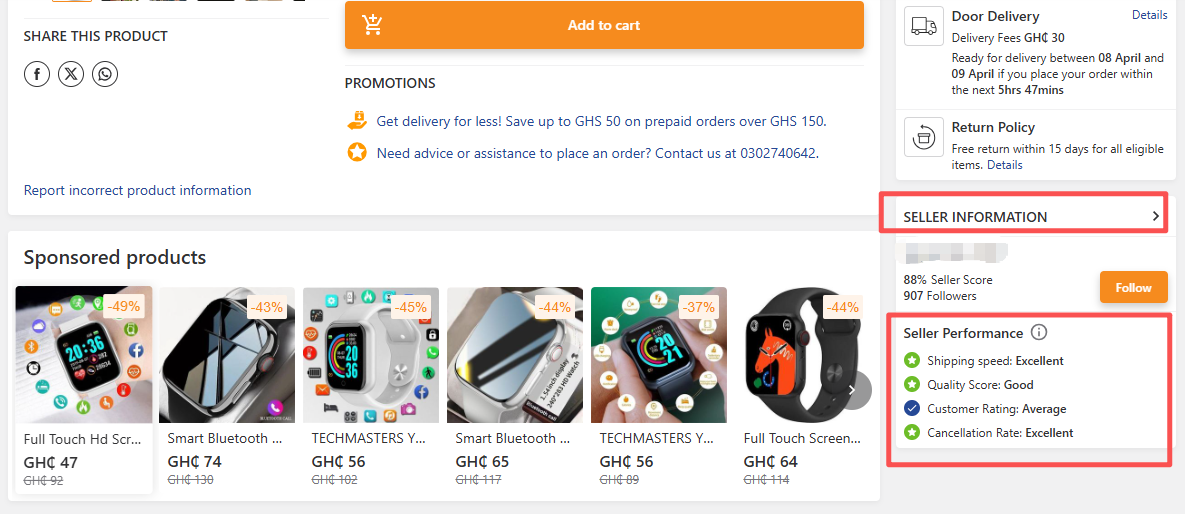
♦ For front-end consumers -> right side of the product page -> SELLER INFORMATION, you can view your store score, as shown in the image below:
Taking the image below as an example, assuming the store score displayed in the Seller Center is 4.4, divided by the total score (5 points), the front-end display shows 88% Seller Score (4.4/5=88%), meaning the seller’s store received 88% of the total score.
3. Store Rating Components and Rating Criteria
The store score is composed of the following four indicators, updated every Sunday:
Important Note: For sellers using overseas warehouses (FBJ), goods are shipped from the warehouse. Shipping Speed and Cancellation Rate (Out-of-Stock) are both rated by 5 points by default.
|
Sr# |
Key Indx | Explanation | Weighted | Calculation Instruction | Note |
| 1 | Shipping Speed (Short as “SS”) | This reflects the speed of a store’s shipping and the stability of its inventory; it refers to the average shipping timeliness score for all orders received by the store over the past four weeks. | 25% | The calculation uses the number of products (items) as the object, rather than the number of orders (orders). | Special Notes: 1) If any of the four indicators has no data within the calculation period, that indicator is invalid, and the remaining three indicators will each have a weight of one-third. 2) If any two of the four indicators have no data within the calculation period, those two indicators are invalid, and the remaining two indicators will each have a weight of 50%.And so on. |
| 2 | Quality Return Rate (short as “QRR”) | This reflects the quality level of the store’s products, calculated as the percentage of products with quality issues verified by the after-sales team within the past four weeks divided by the number of successfully delivered products. | 25% | The return rate is based on the actual number of returned items, not the number of returned orders. Furthermore, the return rate is calculated based on the order delivery date. The calculation method is: Number of quality-returned products / Number of successfully delivered items (Successfully delivered + Number of returned items). | |
| 3 | Average Customer Rating (short as “ACR”) | This reflects consumer feedback on products or services used, and is calculated as the average of all product ratings received by the store over the past four weeks. | 25% | The calculation is based on the number of buyer reviews within the store rating calculation period. | |
| 4 | Cancellation Rate (short as “OOS”) | This reflects the stability of the store’s inventory, referring to the ratio of the number of orders canceled by the seller in the past four weeks to all product orders. | 25% | The calculation is based on the order creation date, using the following formula: Number of OOS items / Total number of valid items. |
Note: “Past 4 weeks” refers to a complete calculation period from week -2 to week -5, based on the week the store score is updated. As shown in the image below, the store score displayed in the backend for week 50 includes weeks 48, 47, 46, and 45, totaling four weeks’ scores (abbreviated as Last 28 days, L28D).
Calculation Method:
- Each KPI will receive a score from 0 to 5 based on its performance, according to the “Scoring Calculation Details” below.
- The final seller score is the weighted average of the four scores, calculated as follows:
Final Score = (SS Score × 25%) + (QRR Score × 25%) + (ACR Score × 25%) + (OOS Score × 25%)
Seller Score Calculation Details:
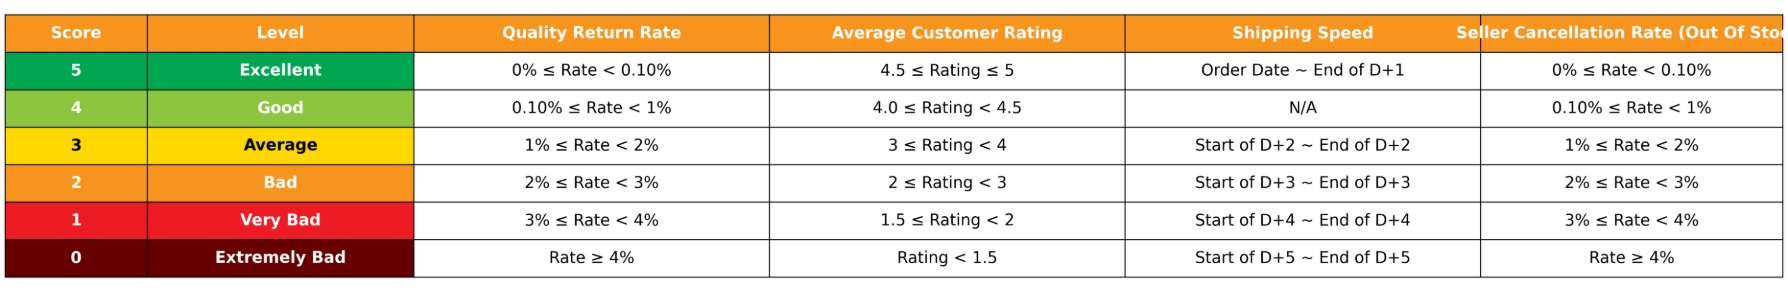
- Note: D represents the order creation date. “D+1 at the end” means the order ends on the next day, and so on.
1) For new sellers, the default store rating is 3.0 within 30 days of store activation. If there are 5 or more successfully delivered orders (i.e., orders with a “delivered” status) within these 30 days, the store rating will then adhere to the above rating standard.
2) Calculation examples are as follows:
♦ Shipping Time (SS) Calculation Example for Week 50
(The calculation scope for week 50 includes weeks 48, 47, 46, and 45, totaling the number of orders generated during these four weeks)
| Site | Store Name | Number of Orders (Week 45 to Week 48) | Total Number of Products (Week 45 to Week 48) | Number of Shipping Products (Week 45 to Week 48) | Shipping Timeliness (Week 45 to Week 48) | Week 50 Shipping Timeliness Score (Average Score of All Products) |
| NG | Jumia | 2 | 60(Order A Contains10 Products,Order B Contains 50 Products) | 59(Order A Contains 9 Products,Order B Contains 50 Products) | Order A: 9 Products’ ShippingTimeliness=D+2, Order B: 50 Products’ ShippingTimeliness=D+3,Order A has one items with No shipping timeliness information. | (9*3+50*2+1*0)/60=2.1 |
♦ Quality Return Rate (QRR) Calculation Example for Week 50
(The calculation scope for week 50 includes weeks 48, 47, 46, and 45, totaling the number of successfully delivered orders during these four weeks)
| Site | Store Name | Number of Orders (Week 45 to Week 48) | Total Number of Products (Week 45 to Week 48) | Returned products(Week 45 to Week 48) | Week 50 Week QRR (Returned Products/total delivered Products) |
| NG | Jumia | 2 | 60(Order A delivered 10 Products,Order B delivered 50 Products) | Order A10 Products were returned because of quality reason. | 10/60=17% |
♦ Average User Rating (ACR) Calculation Example for Week 50
(The calculation scope for the average user rating of the store in week 50 includes weeks 48, 47, 46, and 45, totaling the number of orders generated during these four weeks.)
| Site | Store Name | Buyer Rating Quantity(Week 45 to Week 48) | Buyer Rating(Week 45 to Week 48) | Week 50 Average User Rating(Avg rating based on all customer ratings) |
| NG | Jumia | 9 | Buyer A rated 4 for 3 Product,Buyer B rated 3 for 6 Products | (3*4+6*3)/9=3.33 |
♦ Example of calculating the seller cancellation rate (OOS) in week 50
(The calculation scope for the seller cancellation rate of the store in week 50 includes weeks 48, 47, 46, and 45, totaling the number of orders generated during these four weeks.)
| Site | Store Name | Number of Orders (Week 45 to Week 48) | Total Number of Products (Week 45 to Week 48) | Total Cancelled Products(Week 45 to Week 48) | Seller’s OOS (Week 45 to Week 48) | Score for Week50’s OOS |
| NG | Jumia | 2 | 60 | 1 Product was cancelled because of OOS;1 Product was cancelled by buyer. | 1/60*100%=1.66% | 1.66% will achieve 3 score |
Store rating examples:
1) Assume merchant A’s shipping speed, quality return rate, average product rating and vendor cancellation rate performances are as follows:
First, match the corresponding range, calculate the score based on the range, and finally multiply each score by its weight (1/4) and add them together to obtain the store rating.
| Store Score Measurement Standard | Performance | Range (Level) | Score | Final Score |
| Shipping Speed (Seller Shipping Time, abbreviated as SS) | 3.1 | Average | 3 | 3*1/4+1*1/4+3*1/4+5*1/4=3 |
| Quality Return Rate (Return Rate Caused by Seller, abbreviated as QRR) | 3.5% | Very bad | 1 | |
| Average Customer Rating (Average User Rating, abbreviated as ACR) | 3.5 | Average | 3 | |
| Vendor cancellation rate | 0% | Excellent | 5 |
2) Assume merchant B’s shipping speed, quality return rate and vendor cancellation rate performances are as follows (no product rating data):
First, match the corresponding range, calculate the score based on the range, and finally multiply each score by its weight (1/3) and add them together to obtain the store rating.
| Store Score Measurement Standard | Performance | Range (Level ) | Score | Final Score |
| Shipping Speed (Seller Shipping Time, abbreviated as SS) | 3.1 | Average | 3 | 3*1/3+1*1/3+0+5*1/3=3 |
| Quality Return Rate (Return Rate Caused by Seller, abbreviated as QRR) | 3.5% | Very bad | 1 | |
| Average Customer Rating (Average User Rating, abbreviated as ACR) | / | / | / | |
| Vendor cancellation rate | 0% | Excellent | 5 |
4. Store Rating (Seller Rating) How does the Seller Score affect your store?
- Your store score will be directly reflected on your product pages. Generally, stores with high scores have a conversion rate 5 to 10 times higher than stores with lower scores.
- For stores with high scores, the platform will provide more traffic support; the higher the score, the more traffic will be allocated.
- For stores with low scores (only for stores with a Seller Score < 3), in addition to traffic restrictions, the platform will charge additional operating fees based on different tiers of store score.
This week’s additional operating fees = Last week’s deducted commission * Percentage of additional operating fees corresponding to this week’s store score.
The weekly additional operating fee percentage is as follows:
| Seller Rating Range | Operating Cost Increase Percentage% | Total Commission Deducted Last Week | This Week’s Increased Operating Costs (Local Currency) |
| 3≤Store Rating<5 | 0 | 1750 | 0% x 1,750 = 0 |
| 2.5≤Store Rating<3 | 0.2 | 1750 | 20% x 1,750 = 350 |
| 2≤Store Rating<2.5 | 0.3 | 1750 | 30% x 1,750 = 525 |
| 1.5≤Store Rating<2 | 0.5 | 1750 | 50% x 1,750 = 875 |
| 0≤Store Rating<1.5 | 0.75 | 1750 | 75% x 1,750 = 1,312.5 |
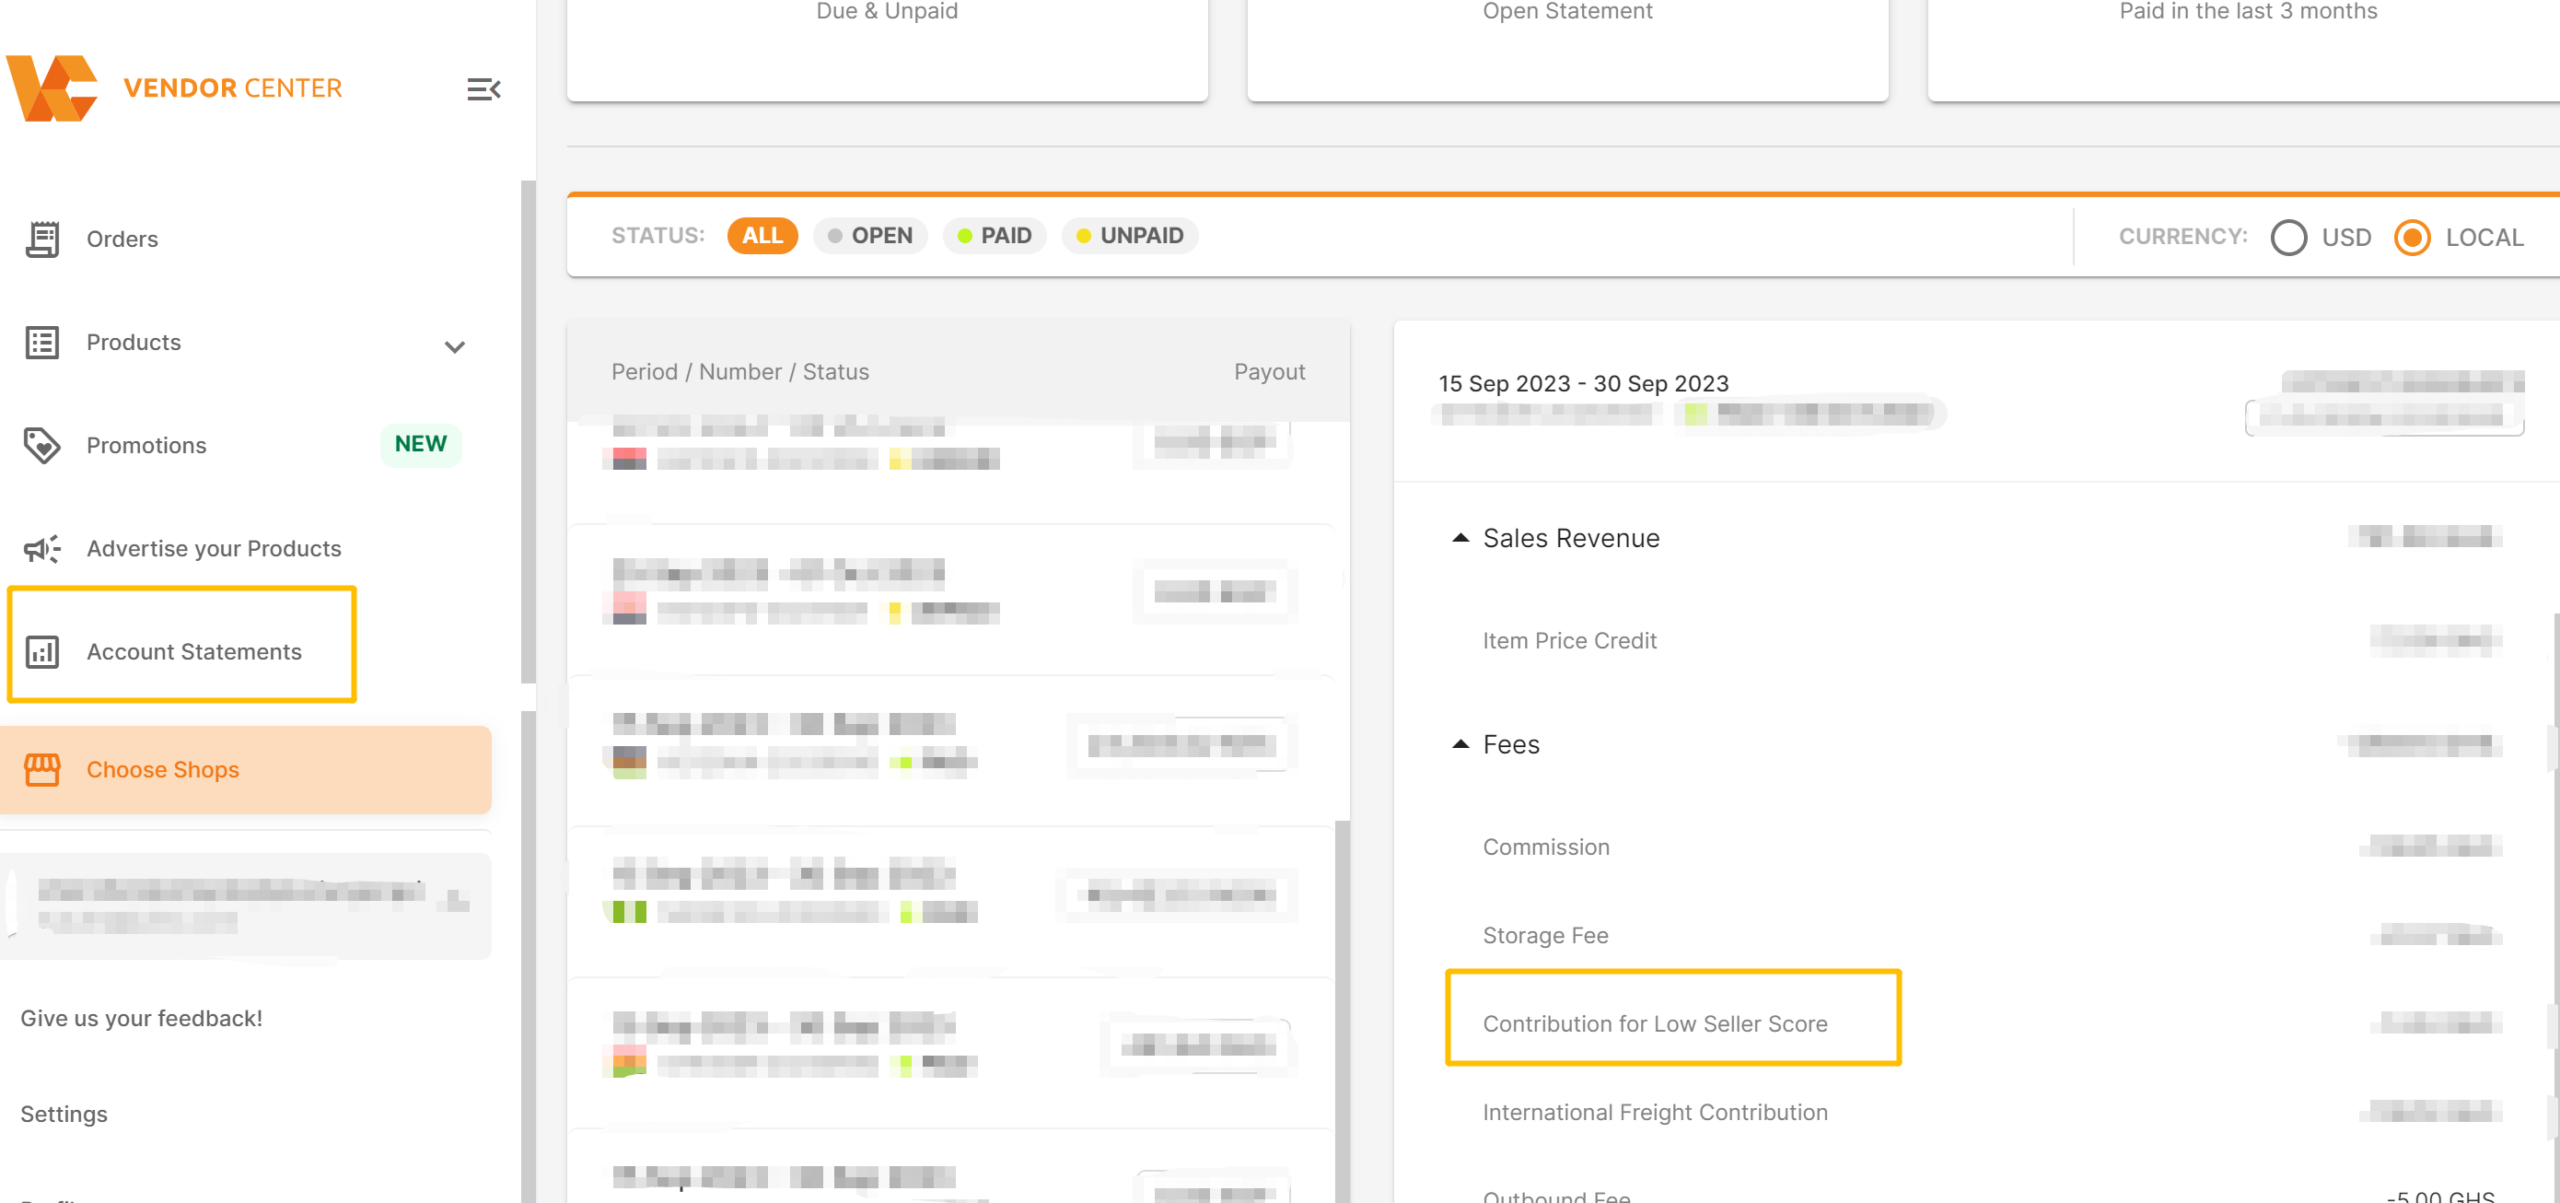
The additional commission will be displayed in the bill as “Contribution for low seller score: Vendor Center -> Account Statements -> Fees,” as shown in the image below:
- High seller cancellation rates, high-quality return rates, slow shipping times, and low product ratings will lead to the following results:
- Products will be unable to participate in promotional activities (only high-quality products will be selected for promotions).
- Decreased exposure (front-end store ratings, added icons, cover images, display documents, and related metrics become visible to buyers, affecting consumer trust in the products).
5. How to improve store scores?
For overseas warehouse (FBJ) sellers, goods are shipped from the warehouse. Shipping speed and seller cancellation rate (out-of-stock) are both rated at 5 points by default. Pay attention to quality return rate and average customer rating.
♦ How to reduce QRR (QRR caused by seller reasons)?
1) Prevention: Ensure the correct products are shipped (color, size, etc.).
- Ensure the products shipped are original (e.g., non-infringing or counterfeit products).
- Use the platform’s packaging guidelines to properly pack products.
- Describe product functions and contents in detail on the product page to ensure consumers receive products consistent with the website description.
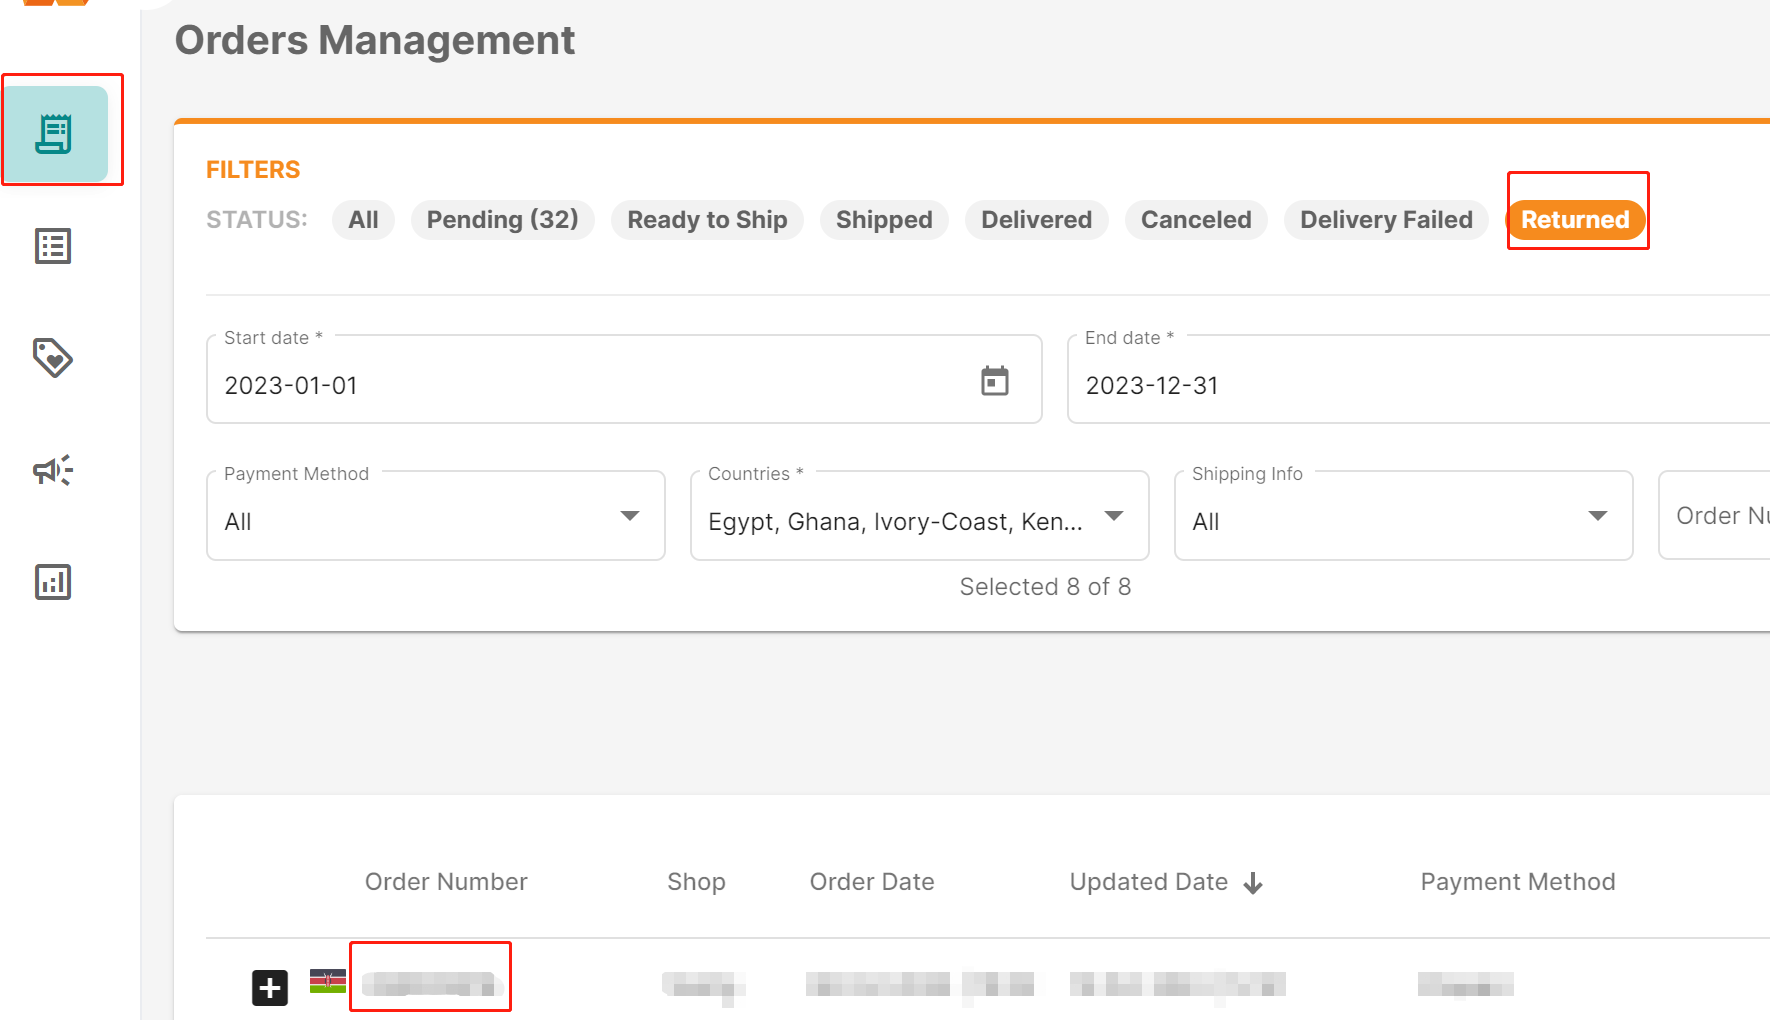
2) Post-Return Optimization: Merchants can find “Return” related orders through the following path. Clicking on the order to view details will reveal the specific reason for the return.
The Vendor Center viewing path is shown in the image below: Order > Returned > Click “Order number” > Click “Order items” details > Click “+”.
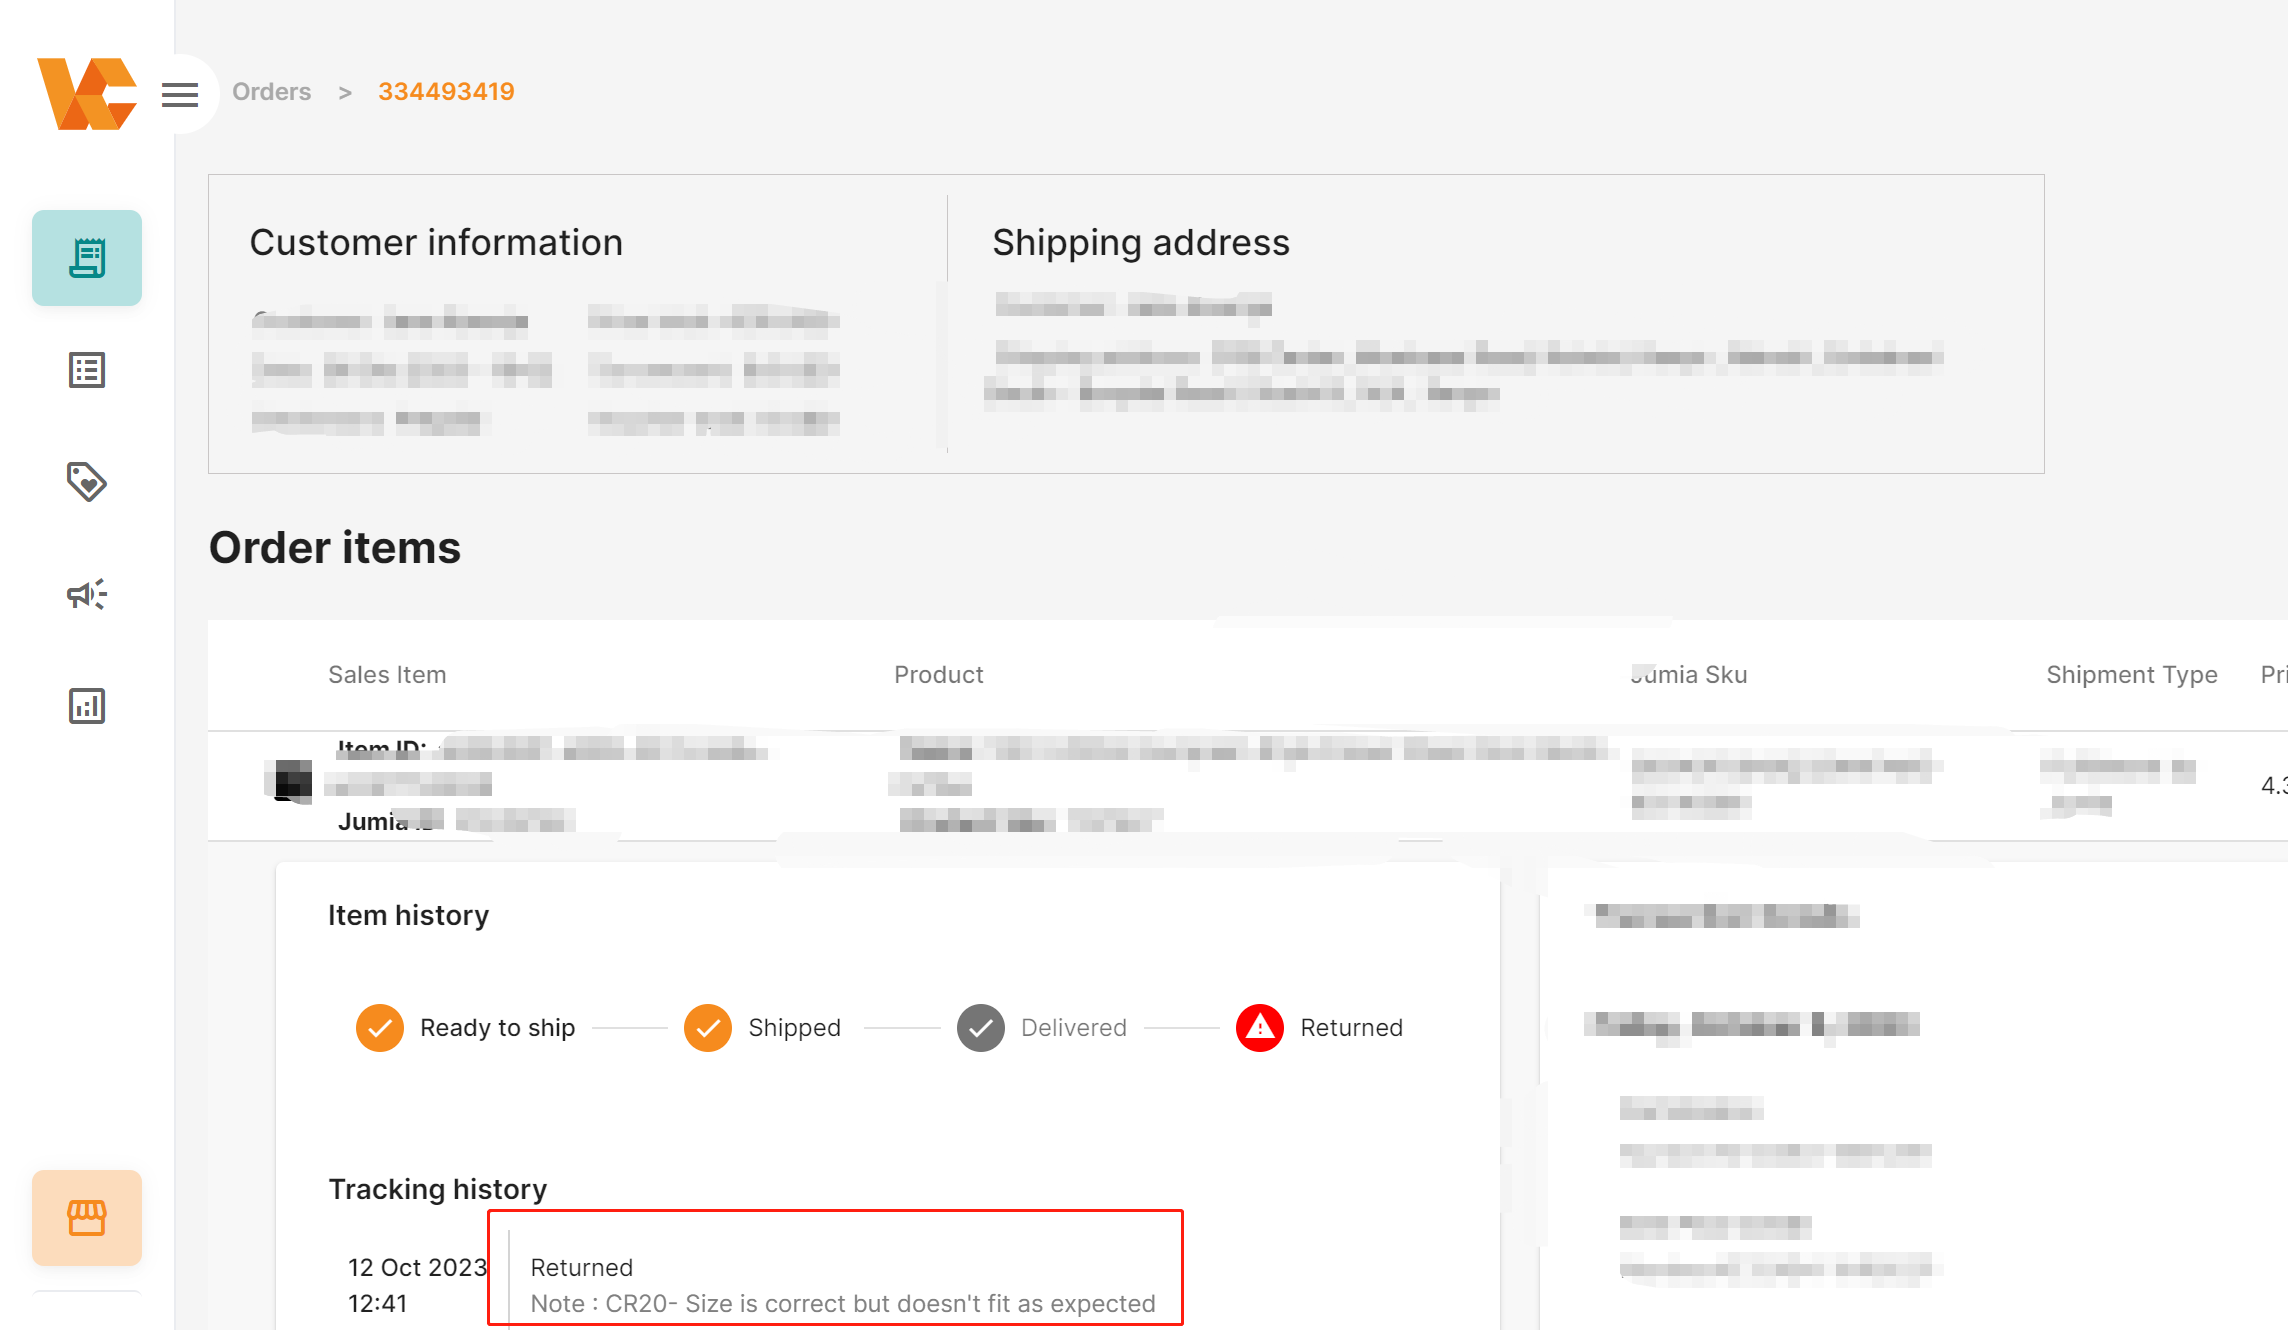
The table below ranks common reasons for Quality Returns. Sellers should focus on orders with the following return reasons and optimize products based on customer descriptions or images provided by the after-sales team to reduce returns.
| Return Reason | RANK |
| CR06 – Item stopped working well after usage | Top 1 |
| CR12 – Item received broken or defective | Top 2 |
| CR24 – Wrong item / color / size / model | Top 3 |
| CR15 – Item received with missing parts or accessories | Top 4 |
| CR13 – Packaging was damaged | Top 5 |
♦ How to Improve ACR (Average Customer Rating)?
Shipping timeliness and return rate affect customer experience to varying degrees. Therefore, improving shipping timeliness and return rate are essential for reducing negative reviews. Additionally,
- Do not over-enhance images to avoid negative reviews due to color differences, etc.
- Product descriptions should include (simple) usage guidelines to avoid negative reviews due to customer confusion about how to use the product.
- Product materials should match the website description to avoid negative reviews due to receiving products different from the website description.
- Fashion products must be sized according to local standards (e.g., Nigeria: UK Size) to avoid negative reviews from consumers who cannot use the product.
- Electronic products must have voltage, plugs, and other accessories that conform to local standards (e.g., Nigeria: UK Standard) to avoid negative reviews from consumers who cannot use the product.